 PmaControl
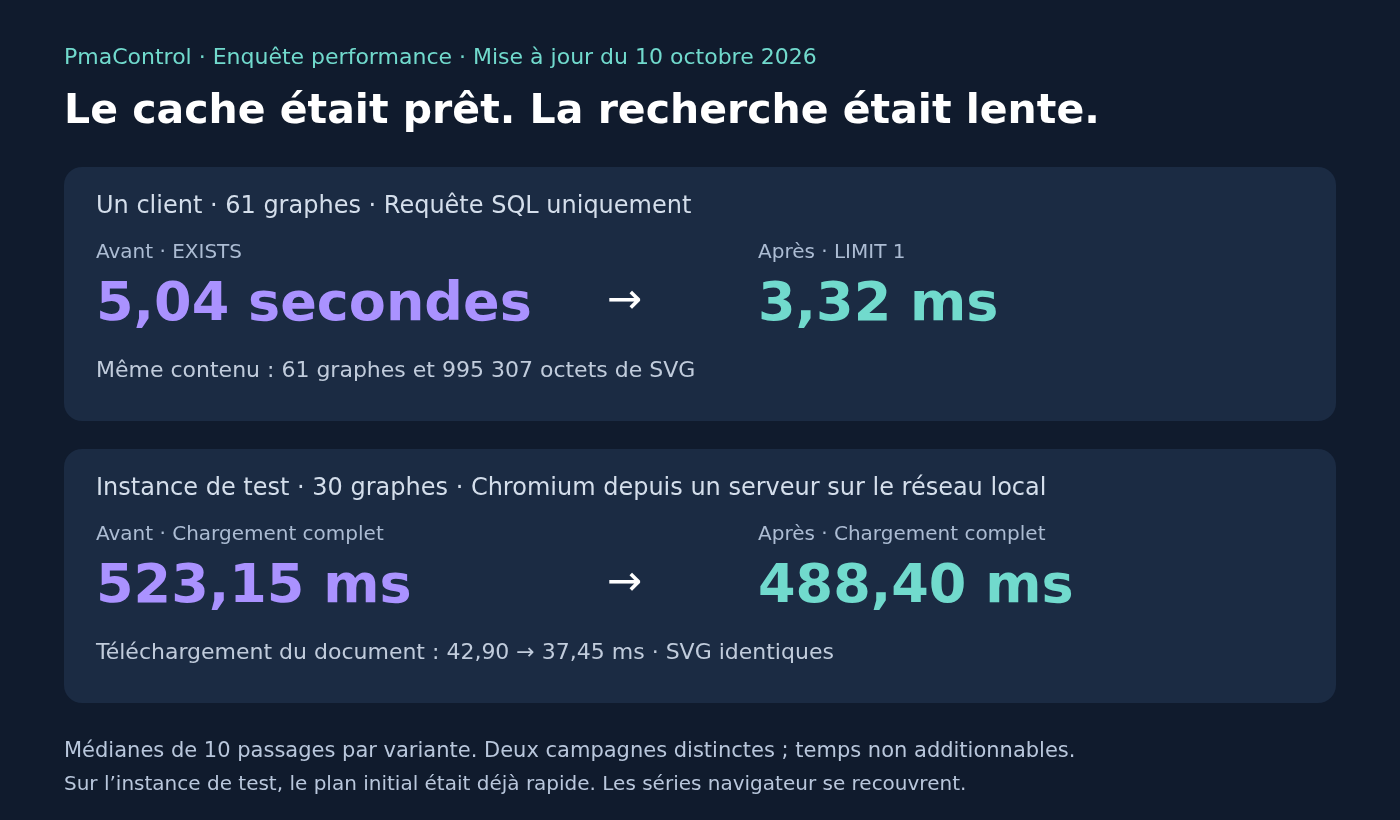
“The drawings are already cached. Why does the Architecture page still take several seconds to display?”
This question led us to a very short fix in PmaControl. There was no missing index. There was also no need to recalculate the drawings. MariaDB had chosen an expensive way to find the generation of graphs to display.
Here are the metrics, SQL, and limitations of this comparison. We distinguish between a client which presented the problem and a test instance which was already quickly executing the initial query.
Updated October 10, 2026. The SQL measurements taken at 1:29 p.m. are included below. Download times were measured again around 1:45 p.m. from a server on the local network because the connection used for the October 9 captures was unstable. Each campaign retains its own environment, graph count and scope: SQL, HTTP download or loading in Chromium.
A box of drawings explains the issue
Imagine a library full of boxes. Each box contains drawings of one generation of the topology. The drawings are already finished: this is our SVG cache.
To display the page, the application still has to find the right box, retrieve its drawings and arrange them on the screen. The library catalog exists: it is the SQL index.
But having a catalog is not enough. In the slow case, MariaDB chose to iterate through millions of entries to prepare an intermediate list of matches. For the verification that interests us, finding a single match is enough.
The fix makes this check explicit. It returns the same drawings while avoiding the costly detour during the lookup.
What was already cached
SVGs are saved in dot3_graph. The dot3_cluster table relates them to the topology generations. The page already retrieves all the graphs with a single SQL query, which returns in particular:
SELECT dg.id, dg.svg, dg.height, dg.width,
       (dg.height * dg.width) AS area,
       dc.date_inserted AS date_refresh
FROM dot3_cluster dc
JOIN dot3_graph dg ON dg.id = dc.id_dot3_graph
-- The condition selects the generation that is ready to display.
The browser therefore receives each drawing, its height, its width and its area. The code in App/Webroot/js/Architecture/topology.js already positions the drawings in the browser. This fix does not change that algorithm.
The cache avoids making the drawings on each visit. It does not avoid searching for, transmitting, and displaying drawings. This SVG cache is separate from the MariaDB query cache and the browser's HTTP cache.
No, there was no missing index
The slow instance already had this unique index, as confirmed by SHOW INDEX FROM dot3_cluster:
-- Existing index, shown as a definition:
UNIQUE KEY id_dot3_information_2
    (id_dot3_information, id_dot3_graph)
The search filters on id_dot3_information, the first column of the index. This therefore makes it possible to find the clusters of a generation.
The problem was in the execution plan: the strategy chosen by MariaDB to run the SQL. The initial version used EXISTS to verify that a generation had at least one cluster. On this instance, that choice caused materialization: MariaDB prepared an intermediate result by scanning approximately 4.33 million historical entries.
This does not mean that the browser received four million graphs. It received 61 graphs. The excessive work occurred in the database before the useful result was retrieved. The figure of 4.33 million describes the order of magnitude of the scan identified during the first diagnosis, not a count of rows transferred to PHP. The October 10 measurements show approximately 5.2 million rows in this instance's table; the volumes in the initial article and the new campaign are therefore not strictly identical.
An index can still be used during a very large scan. Its presence alone does not guarantee a short lookup.
MariaDB, InnoDB / RocksDB configuration and tables
Both environments use MariaDB 11.8.9, with different packages: 11.8.9-deb13 on a client, according to its October 10 report, and 11.8.9-MariaDB-deb12-log on the test instance, verified directly on the server. The client uses PHP 8.4 for SQL replay; the test instance uses FrankenPHP / PHP 8.5.9.
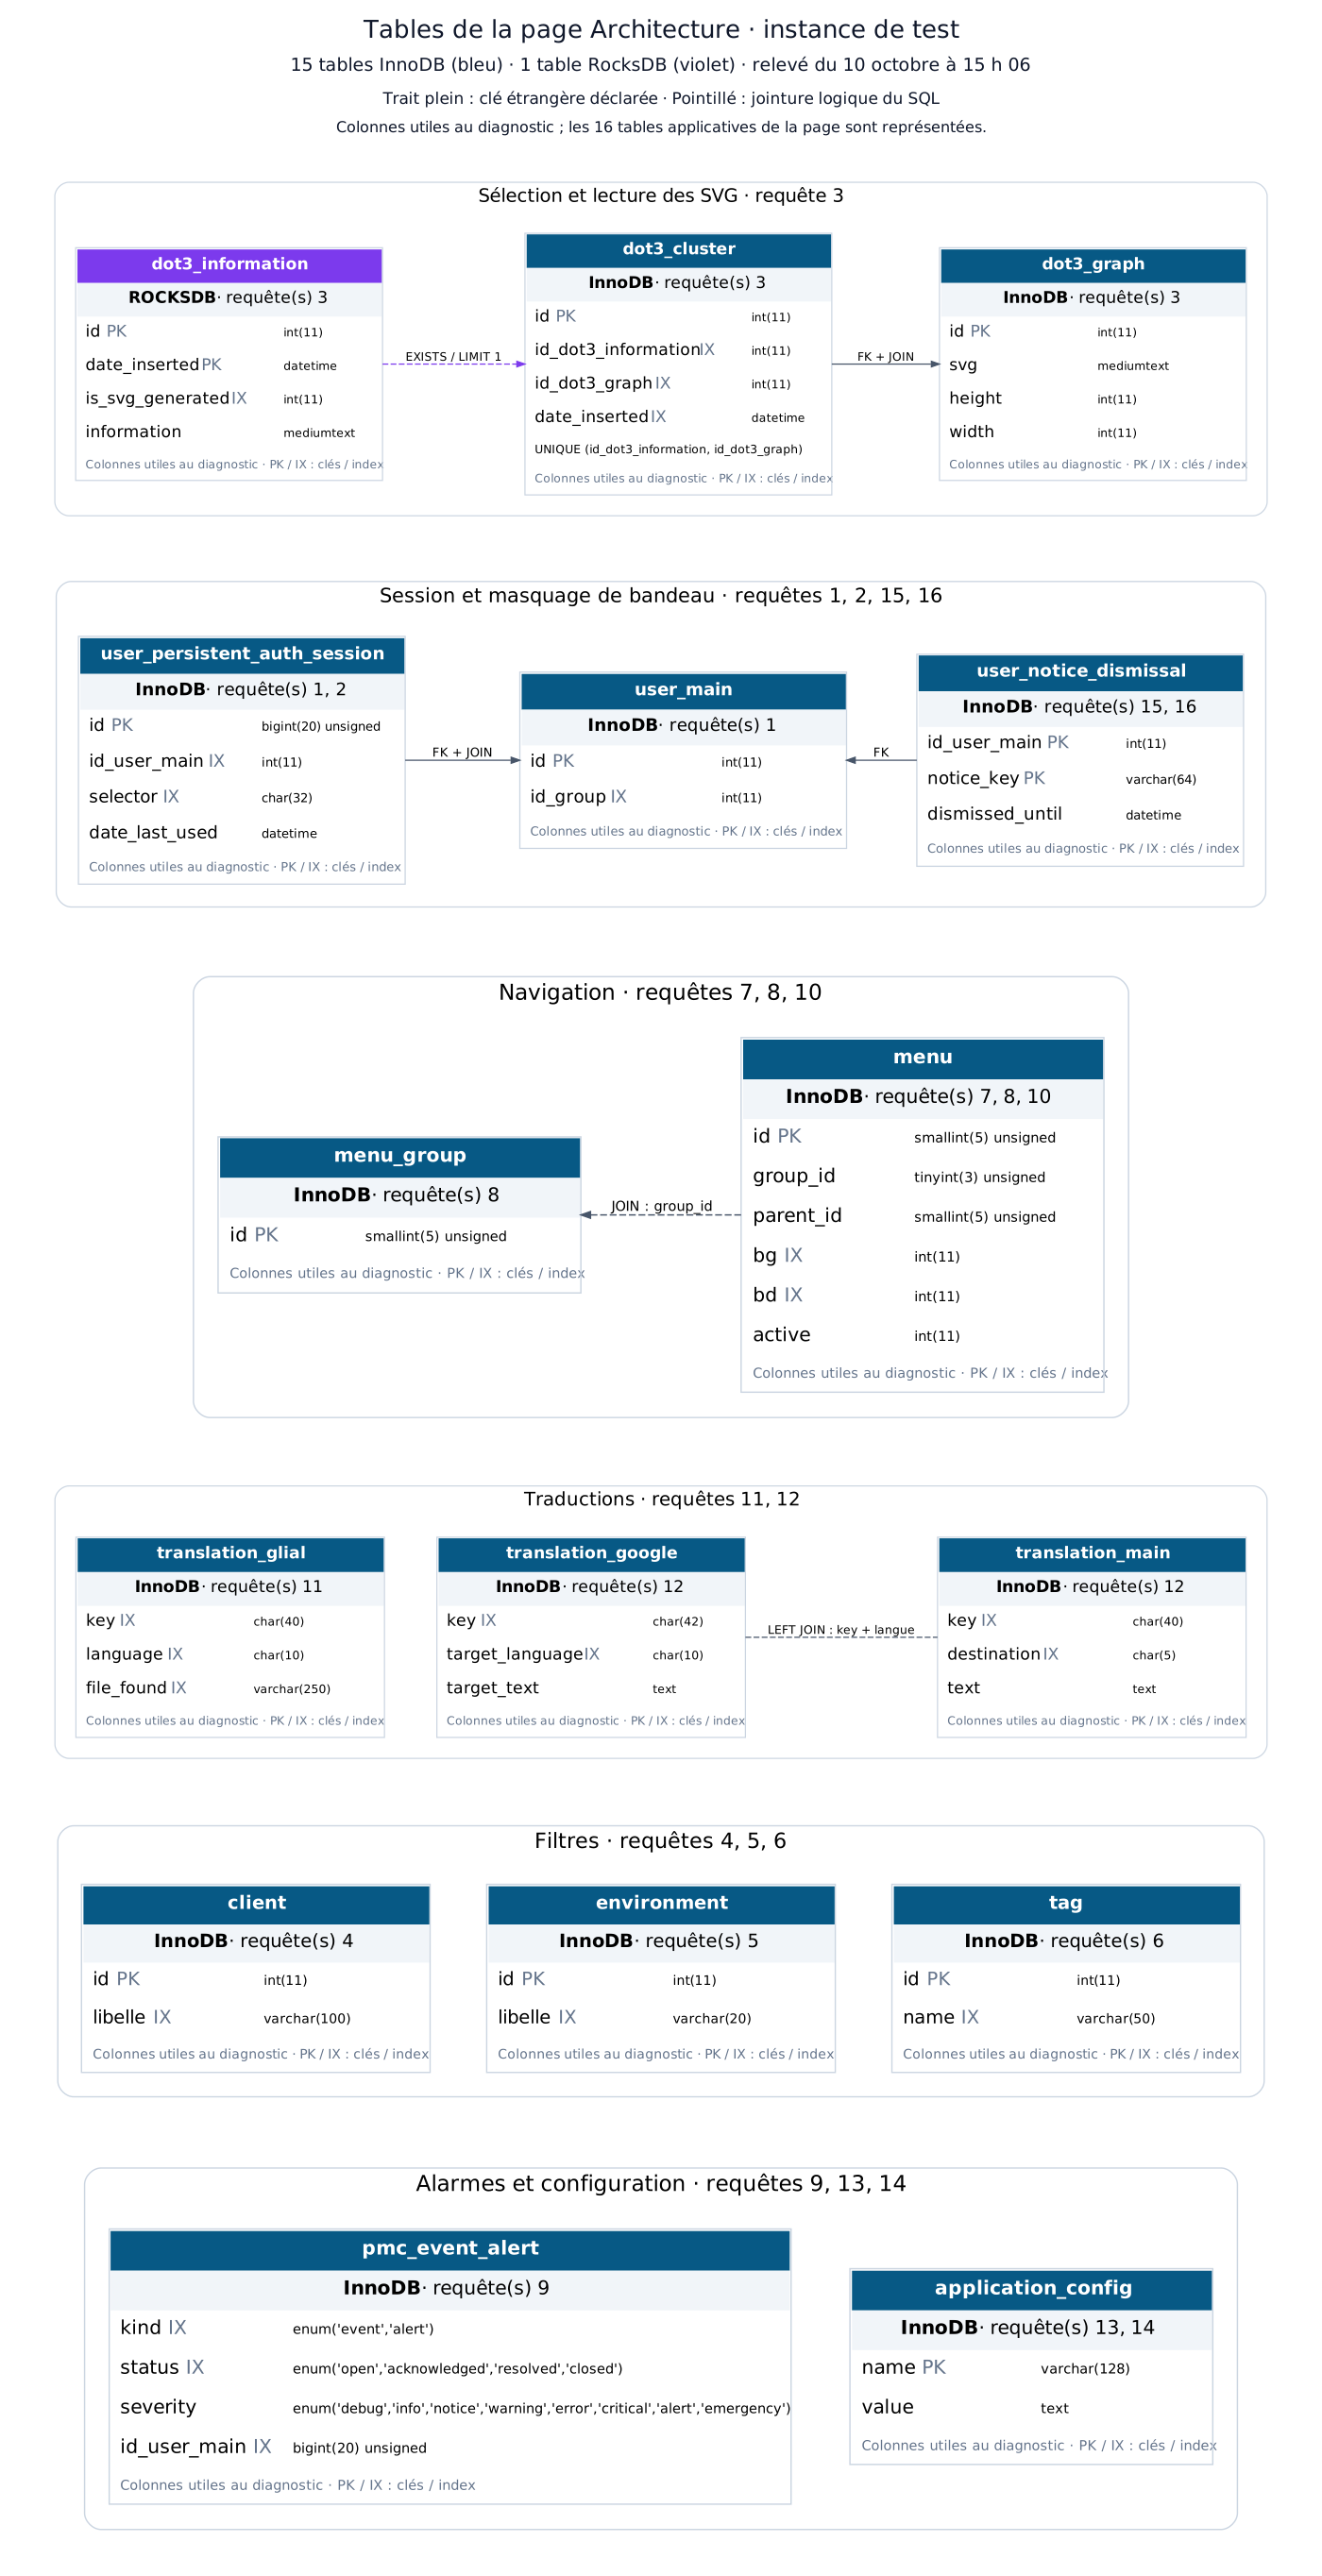
The diagram below covers the 16 application tables used by the page's 16 queries, beyond the three tables in the SVG query. The relevant columns, keys and engines come from the actual schema of the test instance, recorded on October 10 at 3:06 p.m. Table presence checks also query information_schema.tables, a metadata view rather than an application table to classify as InnoDB or RocksDB.
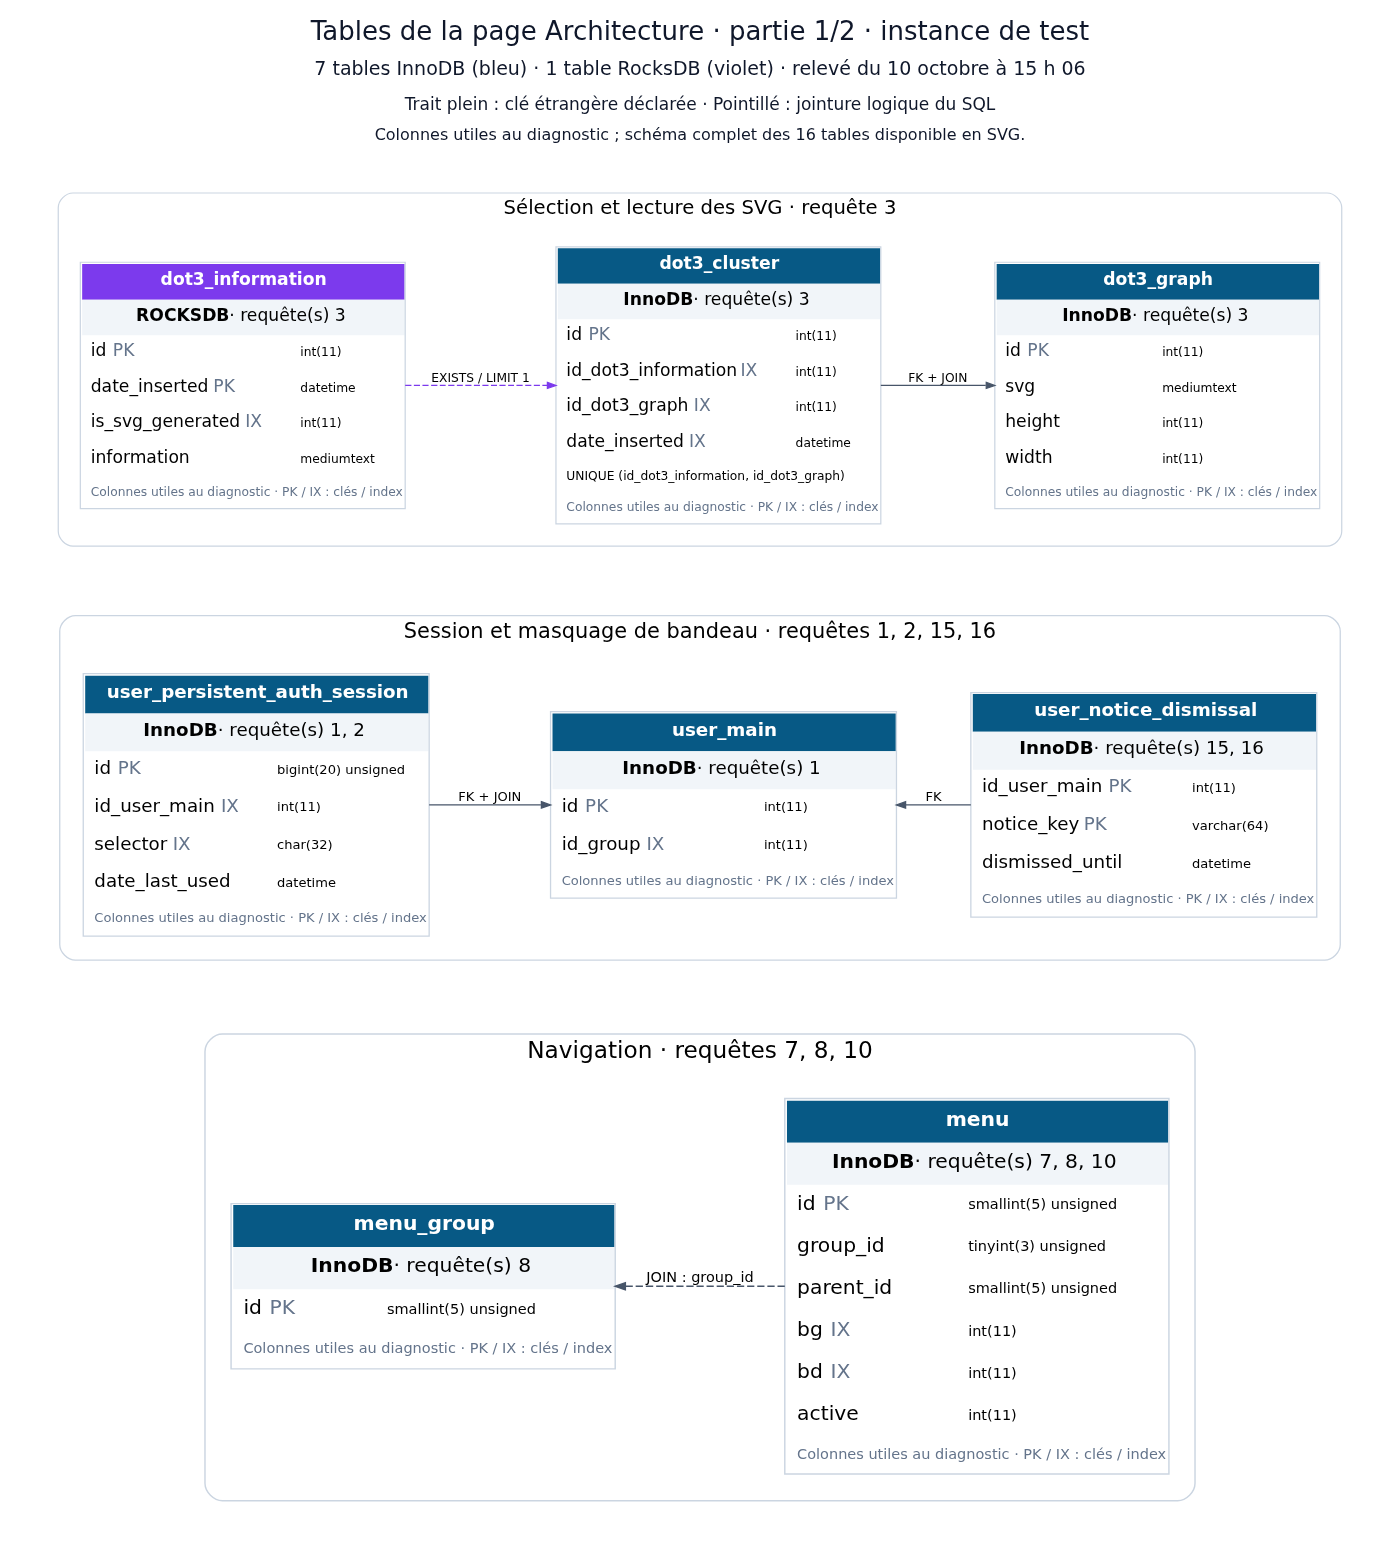
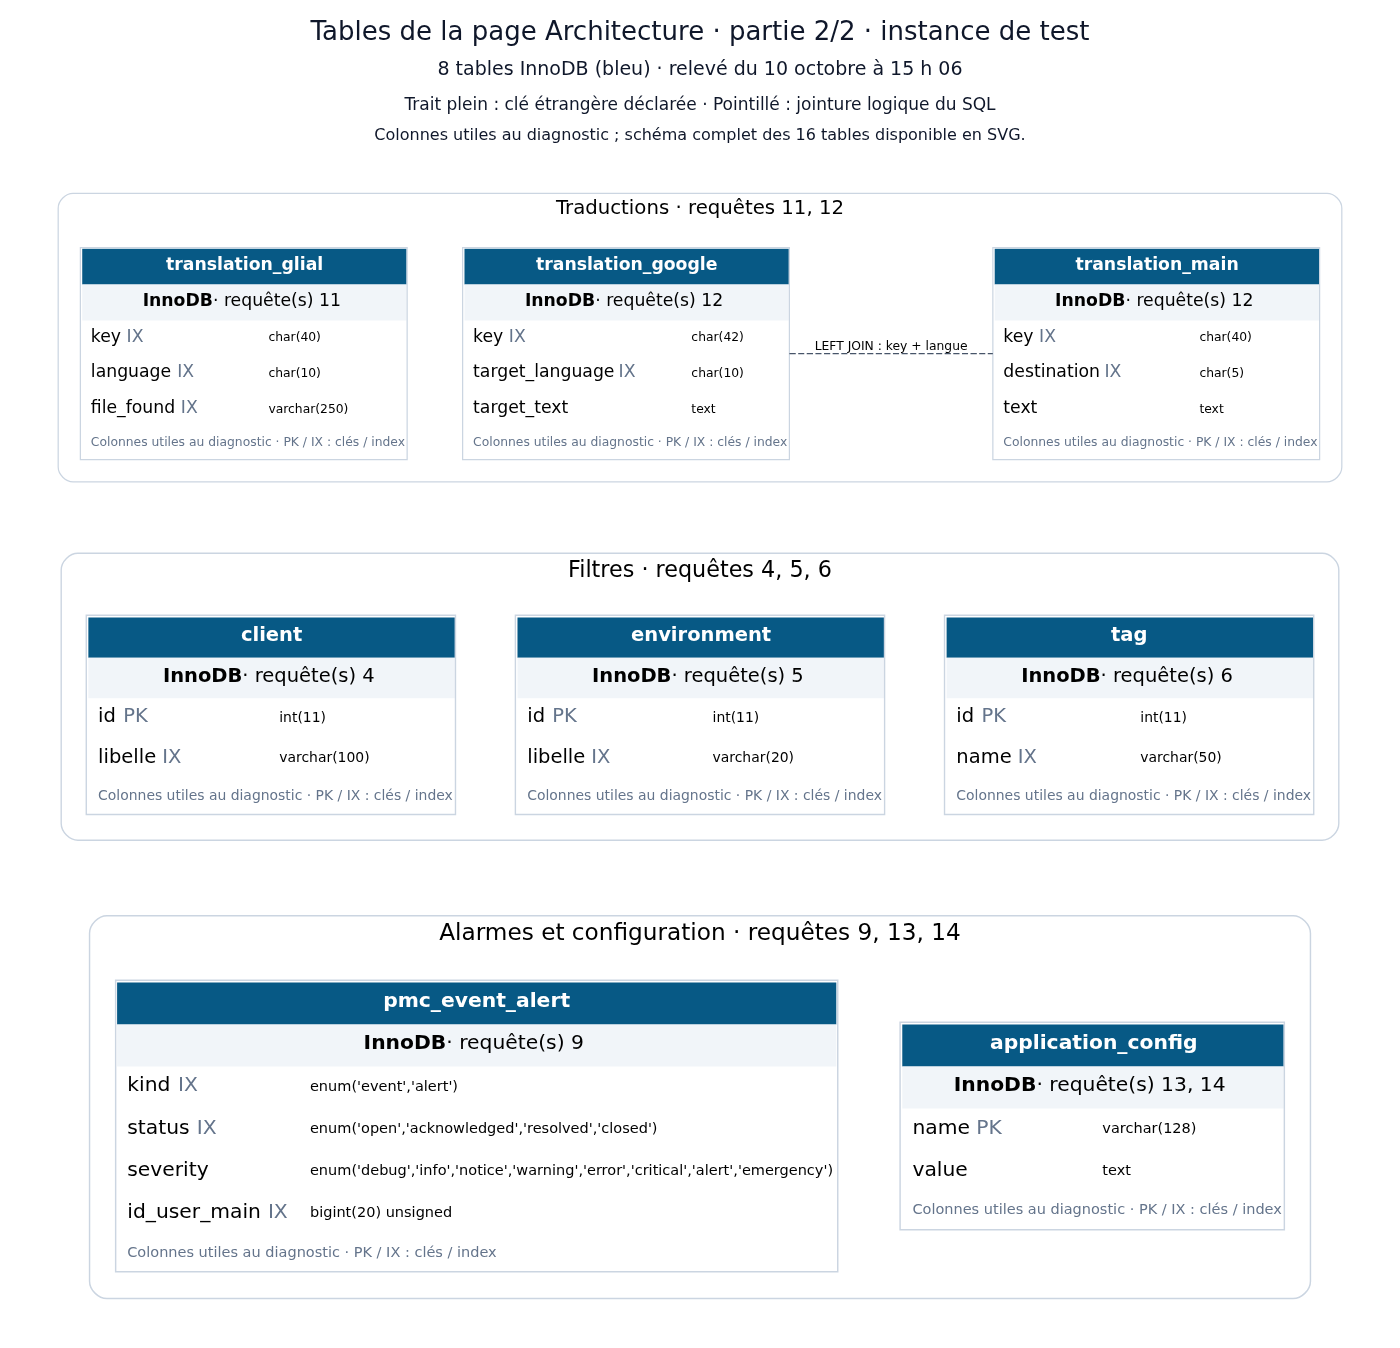
Open the full-size vector diagram. A solid line indicates a declared foreign key; a dotted line indicates a logical join used by SQL. Tables without a displayed link are queried separately. The diagram shows the relationships, not the query execution order.

| SVG query table on the test instance | Observed engine |
|---|---|
dot3_information |
RocksDB |
dot3_cluster |
InnoDB |
dot3_graph |
InnoDB |
The other thirteen tables on the page use InnoDB. The full diagram above and the downloadable engine and size inventory provide the details.
The SVG query therefore crosses two engines on the test instance. The availability index on dot3_information belongs to RocksDB; the unique index on dot3_cluster and the SVG data in dot3_graph belong to InnoDB. The fix keeps these engines and indexes. This campaign compares two SQL formulations; it does not measure a conversion of tables from InnoDB to RocksDB. The customer's measurements do not include its storage engines, so we do not attribute the test instance's schema to that environment.
The anonymized .cnf configuration of the test instance combines the server sections of the included files in their load order. Network secrets and identifiers have been removed. The files contain successive overrides, so the observed global variables show the active values, including a 2 GiB InnoDB buffer pool, 2 GiB RocksDB block cache, 128 maximum connections, 64 MiB for tmp_table_size and max_heap_table_size, and a disabled query cache.
These parameters were collected at 3:14 p.m., after the 1:45 p.m. measurements; some variables can change dynamically. The .cnf resource describes the observed configuration and its overrides, with sensitive values removed; it is not a file to apply directly. The customer's .cnf configuration was not available in the measurements.
SQL modification, before and after
The change is located in App/Library/Dot3LatestGeneration.php, within the selection of the latest generation ready.
Before:
AND EXISTS (
    SELECT 1
    FROM dot3_cluster dc_ready
    WHERE dc_ready.id_dot3_information = di.is_svg_generated
)
After:
AND (
    SELECT dc_ready.id_dot3_information
    FROM dot3_cluster dc_ready
    WHERE dc_ready.id_dot3_information = di.is_svg_generated
    LIMIT 1
) IS NOT NULL
Why is it equivalent here? The outer query already imposes di.is_svg_generated > 0. If a matching cluster exists, the subquery returns that positive identifier. Otherwise, a scalar subquery with no result returns NULL. The condition therefore still checks that a cluster exists for this generation.
The scalar subquery avoids the materialization plan observed with EXISTS. The engine can look up the generation in the index and stop at the first match. The fallbacks used when no ready generation is available remain the same.
This is not a rule saying EXISTS is slow. On our other instance, the old query was already using an efficient FirstMatch strategy. Rewriting all EXISTS would be a bad conclusion: you have to examine and measure the plan of each query.
A customer: new SQL measurements from October 10
The measurements taken at a customer around 1:29 p.m. compare ten runs per variant on production data, after excluding one warm-up run and alternating the before/after order. The production code already contains the fix: “before” here means running the old EXISTS query for comparison, while “after” means the scalar subquery with LIMIT 1.
| SQL Measurement | Before (EXISTS) |
After (LIMIT 1) |
|---|---|---|
| SVG query, minimum–maximum | 4434.17–5297.38 ms | 2.69–6.20 ms |
| SVG query, median | 5044.59 ms | 3.32 ms |
| Total of 16 queries, median | 5068.52 ms | 12.92 ms |
| Returned graphs | 61 | 61 |
| SVG volume | 995,307 bytes | 995,307 bytes |
| Statement index-read counter | 5,199,176 | 3 |
The dominant query goes from 5.04 seconds to 3.32 ms, approximately 1,520 times faster in this reading. The 61 graphs are identical before and after the correction. The current volume differs by 130 bytes from the first diagnosis, which was 995,437 bytes; these are two measurement dates, while both variants of the new campaign return the same content.
The before EXPLAIN plan estimates 4,406,092 entries for materialization; after the fix, it estimates 81 entries for the dependent subquery using the index. These estimates are not counts of reads actually performed. The measurement's index-read counter shows 5,199,176 before and 3 after; dot3_cluster then contained 5,198,990 rows. Plan estimates, observed reads and transmitted graphs are three distinct measurements.
The medians of the other 15 requests all remain under 10 ms. Some fluctuate: the alarm count goes from 9.21 to 0.85 ms, for example, and occasionally reaches 15.55 ms before. This result does not demonstrate that the fix speeds up the count: the server had a load of around 6 and these requests immediately followed a five second request. The code change only concerns the selection of SVGs.
The only change request replayed by this campaign, session refresh, was executed and then canceled. This report measures SQL; it does not measure download or full browser loading. Times include mysqli's full retrieval of results, including approximately 1 MB of SVG.
| Request from a client | Before (ms) | After (ms) |
|---|---|---|
| 1. Read Login Session | 0.34 | 0.34 |
| 2. Refresh session, then cancel | 0.16 | 0.19 |
| 3. Load the 61 graphs and their dimensions | 5,044.59 | 3.32 |
| 4. List customers | 0.53 | 0.29 |
| 5. List environments | 0.78 | 0.15 |
| 6. List tags | 0.60 | 0.22 |
| 7. Find navigation feed | 1.59 | 0.64 |
| 8. Build the menu | 5.26 | 4.24 |
| 9. Count active alarms | 9.21 | 0.85 |
| 10. Select the menu item | 0.78 | 0.66 |
| 11. Check translation key | 0.53 | 0.15 |
| 12. Read the translation | 0.48 | 0.18 |
| 13. Check configuration table | 0.20 | 0.17 |
| 14. Read license settings | 0.17 | 0.15 |
| 15. Check hidden banner table | 0.18 | 0.15 |
| 16. Read the masking of the license banner | 0.30 | 0.13 |
| Total, median of sums per run | 5,068.52 | 12.92 |
The anonymized SQL measurements with timing ranges and both plans complete this table.
Customer download time: comparison assumption
To complete the HTTP comparison, we reuse the download times measured from the server against the test instance, presented in the following section. We assume these durations are identical for the customer. These values are a shared assumption for both environments; they are not a new HTTP measurement at the customer.
| HTML document download, reused as an assumption | Before | After |
|---|---|---|
| Chromium median on the test instance | 42.90 ms | 37.45 ms |
Time to first byte and full page load at the customer were not measured again. The test totals cannot be reused because the customer's SVG query alone took five seconds before the fix. We keep the measured SQL and assumed transfer separate rather than inventing a browser time.
Download and browser: new measurement from a server
To eliminate uncertainty caused by the connection used for the earlier captures, another campaign was run on October 10 around 1:45 p.m., from a Debian 12 server to the test instance on the local network. It uses the same unfiltered Architecture page, the same temporary read-only account, 30 graphs, a 1440 × 900 pixel viewport and Chromium 152. The browser's HTTP cache was disabled; one warm-up load per variant was excluded, then ten loads before and ten after were retained.
The target server uses MariaDB 11.8.9 and FrankenPHP / PHP 8.5.9. The application code is commit 4207dfbe5e7d1709dbbd2efdd2cff8c1e6619dc1; for the before variant, only Dot3LatestGeneration.php comes from its parent, 366b200703ff7550ec01d33e2c7d49c0b570ab15. The measurements use a temporary HTTPS server serving the worktree on the local network. Production remains on the corrected code.
Medians in milliseconds:
| Step measured in Chromium | Before (EXISTS) |
After (LIMIT 1) |
|---|---|---|
| First byte, PHP and transport included | 62.35 | 50.90 |
| Download HTML document | 42.90 | 37.45 |
Document received → event load |
416.05 | 392.20 |
Full page load → load |
523.15 | 488.40 |
The document download ranges from 33.2 to 61.3 ms before and 32.3 to 55.1 ms after. Full page load ranges from 472.3 to 681.5 ms before and 444.5 to 669.7 ms after. These ranges overlap: they show a load time of around half a second over this network path, without establishing a reproducible browser gain of 34.75 ms.
The 30 displayed SVGs have the same SHA-256 on each of the twenty loads. The decompressed document is 2,240,909 bytes in both variants. Its compressed body is approximately 671,254 bytes, or approximately 671,554 bytes including the headers counted by Chromium. This HTML volume and these 30 graphs belong to the test instance; they do not correspond to the 995,307 bytes of SVG for the 61 graphs at the customer.
A separate check with curl --compressed, using ten requests per variant after warm-up, confirms that transfer times remain variable: median download of 70.85 ms before and 93.80 ms after, and complete HTTP response of 119.97 and 145.62 ms. curl does not load page resources or execute JavaScript. Decompression, the HTTP client, the negotiated protocol and server load contribute to the differences from Chromium; those differences do not prove a SQL regression.
Milestones are measured for each visit and then summarized separately: the sum of the medians is not necessarily the median of the total. The time after receiving the document includes other resources, HTML parsing, JavaScript, and rendering. We do not attribute it to the placement of the graphs alone. The first byte already includes the PHP preparation; no estimated PHP time is added to the total.
The earlier load times of 12,948, 2,952 and 843 ms remain historical observations from October 9, available in the archive CSV. Their download time of 470 to 535 ms depended on the unstable connection used at the time, so they are no longer a network reference. The new campaign with 30 graphs does not reconstruct the browser time for the 61-graph instance.
The new SQL comparison on the test instance, ten alternating pairs in a single read-only snapshot with MariaDB query cache disabled for the session, results in 6.94 ms before and 5.81 ms after. The full results and 2,172,396 bytes of SVG are identical. The initial plan there still uses FirstMatch: even with 6,591,509 lines in dot3_cluster, this instance does not reproduce the expensive materialization of the other server. The size of a table alone is therefore not enough to predict slowness.
Test instance: details of the 16 requests from October 9
The detailed table below preserves the instrumented campaign from October 9, on the unfiltered page, using a read-only account and 30 graphs. The first warm-up load was excluded, then five loads were retained for each version. This table is not presented as a new measurement of the 16 queries on October 10.
The application profiler detects 16 requests on each of ten loads. Each line below corresponds to a query executed once before and once after; the last line shows the total. The times below are the medians of SQL calls measured on the PHP driver side, in milliseconds. They do not only represent the internal time of the MariaDB engine.
| Query | Before (ms) | After (ms) |
|---|---|---|
| 1. Read Login Session | 0.31 | 0.34 |
| 2. Refresh session | 0.29 | 0.27 |
| 3. Load the 30 graphs and their dimensions | 5.86 | 5.57 |
| 4. List customers | 0.37 | 0.34 |
| 5. List environments | 0.23 | 0.27 |
| 6. List tags | 0.23 | 0.29 |
| 7. Find navigation feed | 0.71 | 1.07 |
| 8. Build the menu | 3.02 | 3.04 |
| 9. Count active alarms | 1.11 | 1.09 |
| 10. Select the menu item | 0.67 | 0.67 |
| 11. Check translation key | 0.33 | 0.31 |
| 12. Read the translation | 0.30 | 0.29 |
| 13. Check configuration table | 0.33 | 0.31 |
| 14. Read license settings | 0.22 | 0.23 |
| 15. Check hidden banner table | 0.32 | 0.31 |
| 16. Read the masking of the license banner | 0.18 | 0.22 |
| Total, median | 14.53 | 14.59 |
The total is the median of the sums calculated for each load. Adding the medians of each row does not necessarily give this value.
On this test instance, no significant overall SQL gain is demonstrated. The difference of 0.06 ms is minimal. This is explained: MariaDB already chose a good plan for the old query. The fix targets the costly plan encountered on the production instance.
This count covers the application requests of the initial PHP rendering, on the three connections noted by the profiler. It excludes subsequent AJAX calls and internal login commands. These 16 requests should not be assigned to all user profiles or all installations.
Also check that the results remain correct
A faster page is only useful if it displays the right graphs. The verification focused on equality of results before/after, generations ready or absent and fallback solutions.
Nine scenarios were run with test data defined in MariaDB CTEs, without inserting rows into the application tables. SQL comparisons also covered the unfiltered page, the filtered page and graph aggregation, with results compared in the same transactional snapshot. The JavaScript placement test verified behavior across several viewport widths.
A separate series of fifteen paired measurements on the test instance found small median overheads on the filtered and aggregated paths: approximately 0.34 ms and 0.16 ms. We include them in the assessment because the fix does not make every scenario faster. These targeted checks do not replace the full product test suite.
Redo the diagnosis on another page
Start by separating three questions: how long does the server prepare the response, how long does the document take to arrive, and how long does the browser take to finish loading?
Then count the requests and measure each one. For the one that dominates, compare the before/after plan and the equality of results. Check in particular the number of entries searched, the intermediate results and the effective use of indexes. Repeat measurements: a single observation can be misleading.
In this case, a query remained a query, and the index remained the same. It is the way of finding drawings already in cache that has changed.
Detailed data and SQL
- The 16 queries, their location in the code and the complete SQL before/after
- The ten instrumented loads: duration of each request in CSV
- The twenty Chromium loads from the server on October 10, in CSV
- The October 10 HTTP curl control, before and after
- The SQL comparison of October 10 on the test instance: results and plans in JSON
- Anonymized SQL statement from a client: 16 queries, ranges and plans
- The anonymized MariaDB
.cnfconfiguration of the test instance and active variables, version and included files - The schema of the 16 tables in SVG, the SQL definitions, the inventory of engines and sizes in CSV and the columns, indexes and relationships in JSON
- SQL script, provided in text, Chromium script, HTTP script and temporary HTTPS server configuration
- Method and steps for reproducing the October 10 campaign
- Archive: the three production loads of October 9 on the unstable connection
Session and account IDs are replaced by parameters in the downloadable examples. Production and test measurements are separated to allow them to be interpreted without mixing the two environments.
Comments (0)
No comments yet.
Leave a comment